top of page

Search
Time Series and Logistic Regression with Plotly and Pandas
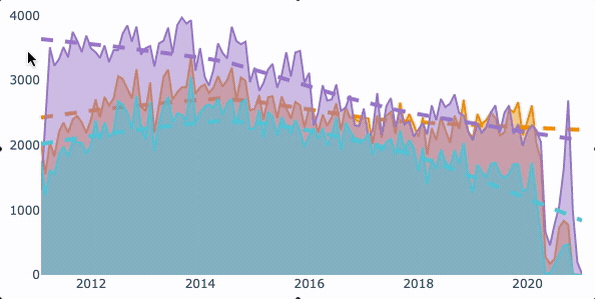
How to visualize area plots and trends lines over grouped time periods with interactive Plotly graph objects. In Brief: Create time...
The Tech Platform
Jan 5, 2022
bottom of page