Business Intelligence (BI) is a common business practice today. BI is the process of making business sense of data using data analytics and tools that eventually help businesses to make various decisions, including operational, product positioning, sales predictions, financial goals, and strategic decisions. Common Business Intelligence functions include reporting, analytics, data and process mining, performance benchmarking, predictive analytics, and prescriptive analytics. The software tools and technologies that are used to process business data and provide business intelligence are often referred as BI Tools.
There are plenty of BI tools or platforms available in the market. Here is a list of my top 10 BI tools based on their rankings, market size, completeness, and recent growth.
Microsoft Power BI
Tableau
Qlik
ThoughtSpot
MicroStrategy
TIBCO Software
Salesforce
Oracle SAS
SAP
Sisense
Top 10 BI Platforms
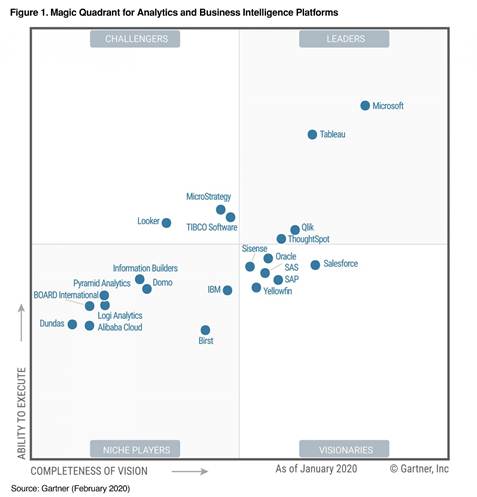
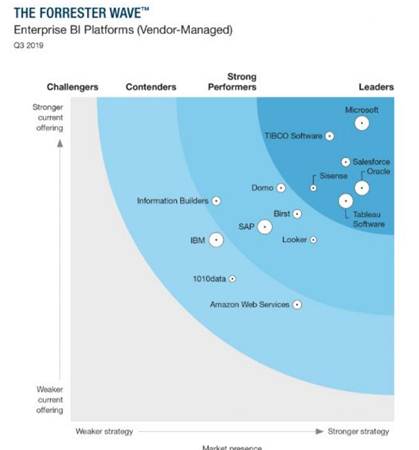
Before we review the above BI platforms in detail, let us look at what Gartner and Forrester have to say about BI platforms.
Gartner magic quadrant for data Analytics and BI platforms lists Microsoft as the clear leader in completeness of vision and ability to execute. Microsoft’s Power BI is one of the newest but fastest growing BI platforms among enterprises. Tableau, Qlik, ThoughtSpot, TIBCO software, and MicroStrategy are next top 5 BI platforms, according to Gartner.
According to Forrester, Microsoft is the top BI platform vendor followed by Salesforce, TIBCO, Oracle, Tableau, and Sisense.
Power BI
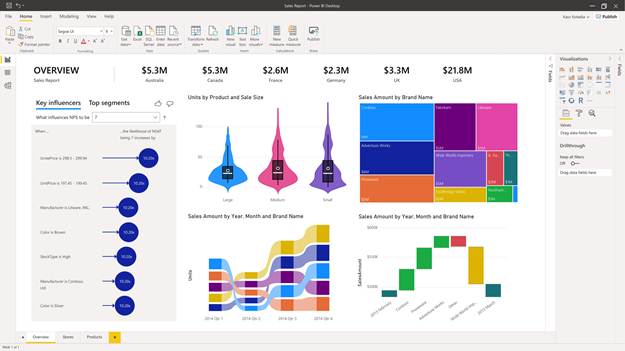
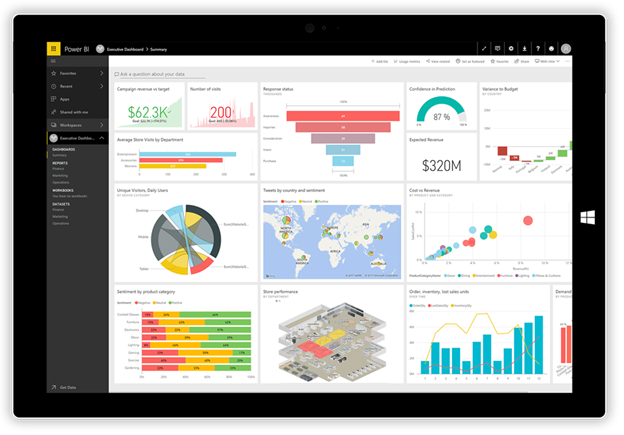
Power BI launched in 2011 by Microsoft’s SQL Server Reporting Services division has become the top BI tool for businesses, according to Gartner and Forrester. Power BI is also one of the fastest growing BI platforms. Power BI is available as a cloud-service via Microsoft’s Azure cloud and Office 365 suite. Power BI is also available as a thick client desktop as well as a mobile app for iOS and Android devices.
Key Features of Power BI
Data access anywhere, anytime, any device
Power BI is a modern and most versatile BI tool among all. Power BI is designed to work with any data, anywhere, anytime, and on any device. It not only supports enterprise servers and desktops and web, but also provides native mobile applications of data analytics, views, and reports. The cloud, Web, and mobile versions of Power BI are flexible enough to access it from anywhere, anytime, and from any browser.
Supports a wide range of data sources
Power BI allows data connectivity and access from hundreds of supported on-premises and cloud-based data sources including relational and non-relational databases, APIs, files, cloud services, Power Platform, and other sources.
Common databases supported by Power BI include SQL Server, Oracle, IBM DB2, MySQL, PostgreSQL, Sybase, Teradata, SAP HANA, BigQuery and more.
Common files supported by Power BI include Excel, Text/CSV, XML, JSON, Folder, PDF, and SharePoint folder.
Azure data sources support includes Azure SQL Database, Azure SQL Data Warehouse, Azure Analysis Services database, Azure Database for PostgreSQL, Azure Blob Storage, Azure Table Storage, Azure Cosmos DB, Azure Data Lake Storage, and Azure HDInsight.
Besides the above files and data sources, Power BI can be used to connect with a variety of Online Services data sources using data connections such as SharePoint Online List, Microsoft Exchange Online, Dynamics, Azure DevOps, Salesforce Objects, Salesforce Reports, Google Analytics, Adobe Analytics, Smart sheet and many more.
Power BI versions and pricing
Power BI is a modern and versatile product that has six versions to support Web, cloud, desktop, and mobile. Power BI products include Power BI Desktop, Power BI Pro, Power BI Premium, Power BI Mobile, and Power BI Embedded.
Power BI Desktop is a client application installed on your machine. It allows you to connect to all kinds of data sources and create reports and analytics on your local machine.
Power BI Pro is the most popular offering of Power BI. It is a self-service and modern BI in Microsoft’s Azure cloud that allows for live collaboration, publishing, sharing, and ad-hoc analysis. The price of Power BI Pro is $9.99 per month, per user.
Power BI Premium is the enterprise BI with big data analytics, cloud, and on-premises reporting. Key features are advanced administration and deployment controls, dedicated cloud compute and storage resources, and any user can consume Power BI content. The monthly price of Power BI Premium is $4,995 per dedicated cloud compute and storage resource with an annual subscription.
Power BI Embedded allows you to embed Power BI reports, analytics, and dashboard in your applications as your own. Price of Power BI Embedded is Pay for what you use, varies from $1 per hour to $32 per hour, depending on node type and virtual cores. For example, the price of A1 node type with 1 virtual core with 3GB RAM is $1.0081/hour and the price of node type A6 with 32 virtual cores and 100 GB RAM is $32.2506/hour.
Power BI Mobile is a mobile app that allows one to access and view live Power BI dashboards and reports on any device, with native mobile BI apps for Windows, iOS, and Android.
Tableau
Tableau was one of the pioneered in the BI world and was the top BI tool until recently Power BI took over as the top player. Currently headquartered in Seattle, WA, Tableau was founded in 2003 by Christian Chabot, Pat Hanrahan and Chris Stolte, in Mountain View, California. On August 1, 2019, Salesforce acquired Tableau. Prior to Salesforce acquisition, Tableau had about 4,100 employee and $1.2 billion annual revenue.
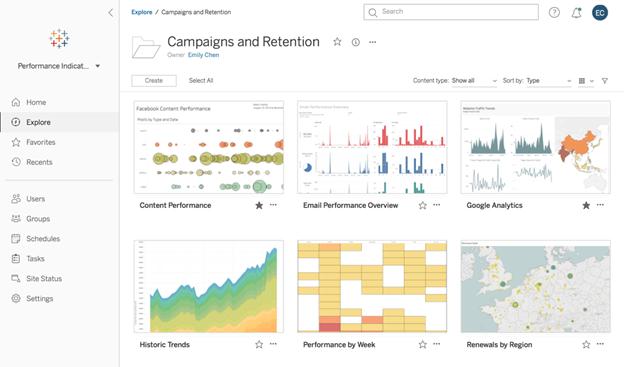
Tableau is one of the most powerful, secure, and flexible end-to-end data analytics platforms among BI platforms. Key Tableau products are Prep, Desktop, Online, and Server. Other components are Tableau Vizable, Tableau Public, Tableau Reader, and Tableau Mobile.
Tableau Prep is how you get your data ready for analysis. It empowers more people to combine, shape, and clean their data quickly and confidently.
Tableau Desktop is where the analysis happens. With an easy to use interface, Tableau Desktop upended the business intelligence industry.
Tableau Online is your answer to self-service analytics in the cloud. No need to manage a server. Secure. Scalable. And look Ma! - No hardware to maintain!
Tableau Server provides true enterprise-scale analytics your business will love, making it easy for people to share and manage data and insights on-prem or in the public cloud.
Tableau supports various data sources including SQL Server, Oracle, IBM DB2, MySQL, PostgreSQL, Sybase, Teradata, SAP HANA, BigQuery, and online data sources such as Google Analytics, Salesforce, and SAP.
Basic pricing of Tableau Creator is $70 per user per month, Tableau Explorer is $35 per user per month and Tableau Viewer is $12 per user per month.
Qlik
Qlik is at #3 spot among top BI tools. Qlik founded in 1993 in Sweden is currently headquartered in King of Prussia, PA. Qlik has about 2,500 employees and $900 million annual revenue.
QlikView and Qlik Sense are two major products of Qlik for business intelligence and data visualization.
QlikView was one of the first-generation BI solution drove the shift in the market away from large, IT-driven, stack-based technologies to more agile data discovery approaches, kicking-off the data analytics revolution.
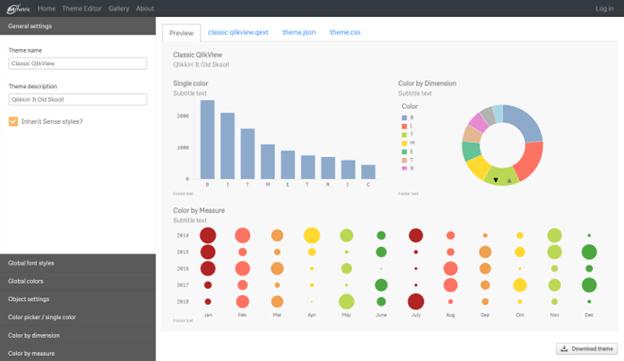
In 2014, Qlik announced Qlik Sense, a modern, self-service oriented analytics. Qlik Sense supports the full range of analytics use cases across an organization — from self-service visualization and exploration to guided analytics apps and dashboards, conversational analytics, custom and embedded analytics, mobile analytics, reporting, and data alerting. Qlik Sense is the main offering of the company that is a superset of QlikView.
Qlik Sense has two editions, Qlik Sense Business and Qlik Sense Enterprise. Qlik Sense Business pricing starts at $30 per user per month. Qlik Sense Enterprise pricing starts at $70 per user per month.
In 2019, the company launched Qlik Cloud Services, Qlik’s Software-as-a-Service environment. Qlik can also be deployed on any public cloud under a single license.
ThoughtSpot
ThoughtSpot is ranked #4 among top BI leaders according to Gartner. Founded in 2012 by a team of ex-Google, ex-Microsoft, ex-Oracle, ex-Yahoo and other ex-Companies, ThoughtSpot has raised over $500 million valued over $2 billion.
ThoughtSpot is a search and AI-driven analytics platform that allows you to build your data analytics and predictive analysis reports quickly using voice and AI.
Key features of ThoughtSpot include the following,
Easy, Guided Search Experience
SpotIQ Automated Insights
Intelligent Search Suggestions via DataRank
Customizable Synonyms for Real-time Keyword Validation
Query Transparency via Search Inspector
Automatic, Best-fit Chart Creation
Dynamic Pinboards with Drag-and-Drop Capabilities
One-click Sharing of Pinboards
Drill Anywhere without Predefined Drill Paths
Custom Branding
Native & JDBC/ODBC Compliant Connectors
High Speed Bulk Data Loader
Easy Cross-Source Analysis
LDAP & SAML Integration
Granular Row & Column-level Access Control
In-memory Calculation Engine for Sub-second Responses
Intelligent Data Sharding & Replication
Built-in Fault Tolerance
Scale-Out Ready
MicroStrategy
MicroStrategy was founded in 1989 by Michael J. Saylor and Sanju Bansal is a Virginia based BI and data analytics company. In 2019, the company’s annual revenue was $486 million and had 2,396 employees.
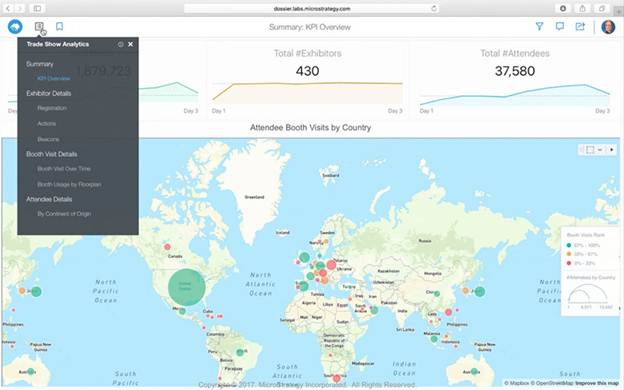
The MicroStrategy platform provides all the capabilities organizations need to build and deploy analytics and mobility applications that transform and accelerate business. By putting answers in everyone’s hands, regardless of role, function, or skill level, MicroStrategy’s suite of products helps your organization become an Intelligent Enterprise.
TIBCO Software
TIBCO Software founded in 1997 is a Palo Alto, CA based BI and data analytics company. TIBCO has about 4,200 employees with annual revenue $1.1 billion.
The following is a list of key TIBCO BI products,
TIBCO Data Science
TIBCO Data Science software helps organizations innovate and solve complex problems faster to ensure predictive findings quickly turn into optimal outcomes.
TIBCO Spotfire
TIBCO Spotfire is the most complete analytics solution in the market, making it fast and easy for everyone to visualize new discoveries in data. With search and recommendations powered by a built-in artificial intelligence engine, anyone can explore data to bring new insights.
TIBCO Data Virtualization
An enterprise data virtualization solution that orchestrates access to multiple and varied data sources and delivers the datasets and IT-curated data services foundation for nearly any solution.
Salesforce
Besides Salesforce’s Tableau, Einstein Analytics is another BI product offered by Salesforce. If we combine both of these products, Salesforce is probably one of the top 5 BI companies. Similar to any other BI product, Einstein Analytics provides data visualization, data and predictive analytics, and reporting capabilities.
Einstein Predictions $75 USD/user/month, Einstein Analytics Growth is $125 USD/user/month, and Einstein Analytics Plus with AI built in is $150 USD/user/month.
Oracle SAS
Oracle offers BI services via its Oracle Analytics and Oracle BI products.
By integrating emerging technologies, including machine learning (ML) and artificial intelligence (AI), Oracle Analytics ensures that organizations do not have to compromise between governed, centralized, and self-service analytics. Instead, Oracle combines these three powerful forces into a single solution.
Oracle Analytics platform enables you to simplify your analytics strategies with a modern, standard, and integrated platform. With advanced analytics, all key decision-makers are empowered to quickly find answers to predictive and statistical questions. While users across the organization can now craft a thoughtful, compelling, and visually stunning analytical story using data visualization extensions.
SAP
SAP offers its BI tools including self-service business intelligence, modeling tools for geo analysis and multi-level hierarchies, data exploration and visualization via its SAP Analytics Cloud.
SAP Analytics Cloud is a complete, end-to-end SaaS solution that delivers all the analytics capabilities such as business intelligence, enterprise planning and augmented analytics in one place for better business outcomes.
Sisense
Sisense is a BI software and analytics platform that allows its customers to easily prepare, analyze & explore growing data from multiple sources.
Conclusion
So, what is the best BI tools for you? It all depends on your needs and expertise. You need to look into the tools that best serve your purpose and is in your price range. For example, if you're a Microsoft shop and have your products in Azure, Power BI is probably the best option for you. If you're an Oracle shop and have data in Oracle database and also have Oracle resources, you may want to look at Oracle BI.
References
Product owners and their respective websites and documentation.
Wikipedia
Various papers, tax filing on the Internet.
Images and content are copyright of its respective owners.
Source: Paper.li









Comentarios