Overview
Sometimes, there is a situation where when we open a report and click on any visual it accidentally nudges a chart a little bit to the right or left. Sometimes, by mistake when viewing a report, the arrangement of visuals scatters a little bit.
Microsoft rolls out one new amazing feature to resolve this issue, that is, Lock Objects in Power BI.
Advantages of using this feature
When our purpose is to only view a report, this feature is a boon for us.
Visualization’s position is not changed.Saves a lot of the developer's time to resolve the position related issues.
Note - This feature is not saved with the report. So, every time you open a report, you need to enable this feature.
Now, let’s understand this feature in a brief manner. To understand this, I will first show you one report in which I have not enabled “Lock Objects” feature.
Step 1
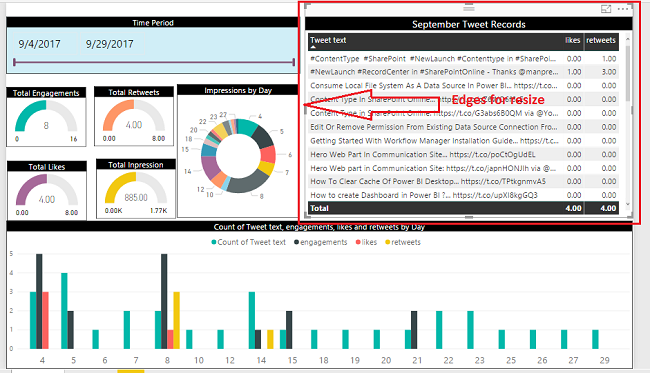
The below screenshot shows my report which doesn’t have the enabled Lock Objects feature.
Step 2
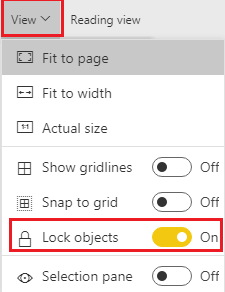
Go to View > Click on 'Lock Objects".
Step 3
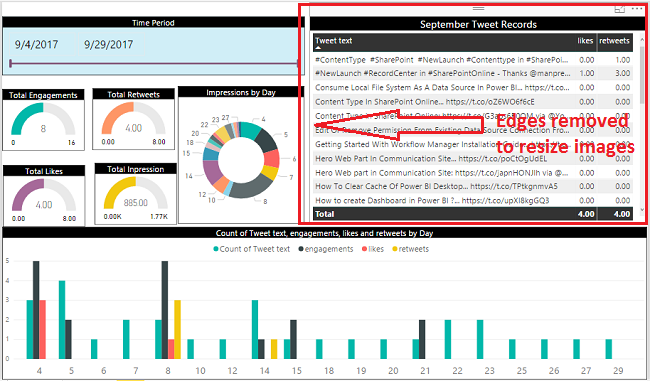
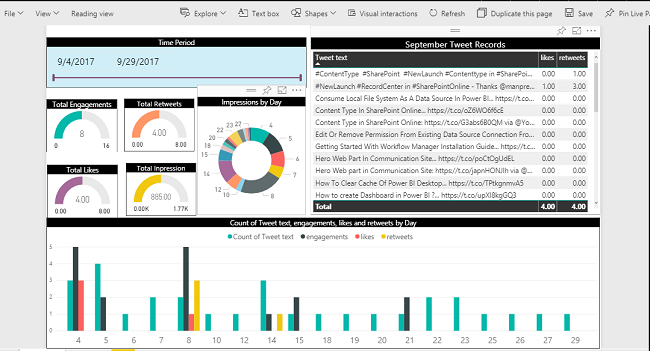
Now, observe the following visual. After enabling this feature, it turns off the resize and move functionality.
Step 4
The same option is also available for Power BI Online. Publish Power BI report to the Power BI Online.
Step 5
Go to View > Lock Objects.
Conclusion
This is how we can use this amazing feature rolled out by Microsoft, i.e., Lock Objects.


Comments