Welcome to an article on Microsoft Power BI, which itself says “Bring your data to life”. This platform will provide you amazing data analyzing and sharing components, which will bring your data to life. Power BI is an interaction between the raw data you use to a neatly elaborated product slide.
You have a dashboard, report solutions, datasets solutions to provide all at one place to be used by you in a lively data panel. Power BI allows you to connect to the world’s most used 60 data tools, where you just have to put in your credentials and all the data will come up with the new illustrative panels.
List of all tools: – https://powerbi.microsoft.com/en-us/#connect-wrapper
Let’s see what will be the major advantages of using Power BI.
Dashboards
Power BI provides you a 360 degree view dashboard providing you with a rich look of data and your connection tools all in one place. Power BI supports the data of all your connection tools at one place providing an automatic data refresh to keep all the data accurate so you don’t have to login to the connection tool as all will be provided at just one Power BI Dashboard.
Using the Power BI gateways, you can connect SQL Server databases, Analysis Services models and many other data sources to your same dashboard in Power BI bringing you all at one platform.
It’s not yet over, there is much more.
Reports
A report is a view into your data with Visual designs of the graphs or content, which represents the insights from the data of the imported file. You can choose which or what view to have on your reports, which our Power BI will generate.
You can import your Excel or .CSV files and all the data will be stored with the real time values. You can get the data from your local computer or One Drive or from other external resources, all within a single platform.
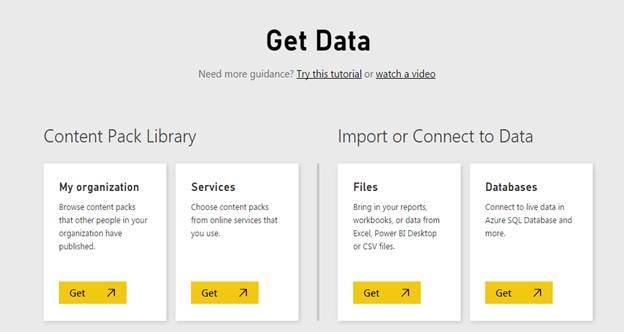
Choose from various options to load your content, as content packs or services, or upload them as files or databases.
Datasets
This is one of my favourites, which will provide you the various visual options to choose from your content.
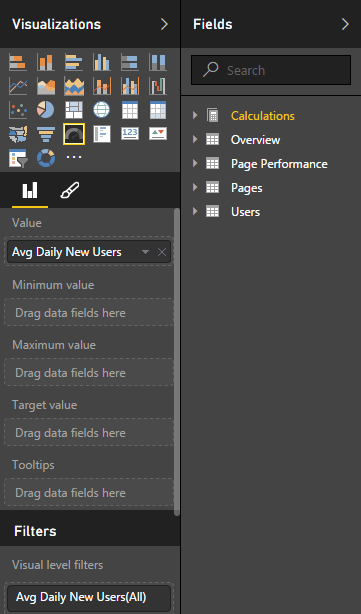
The fields will be displayed from your data and you just need to click on the visualizations to view what kind of a dataset, you require.
A dataset can be formed with the content of your data packs or services or by uploading them as files or databases. These fields can be populated on the data beautifully as graphical figures are being viewed by you or your team. The best part is it will not be static and will fetch the results in real time. Thus, Microsoft Power BI is all set to offer you real time data with the graphical representation on just some clicks, preparing a dashboard for you and your team to use for your daily end to end process.
We’ll see our dashboards in our forthcoming article. Until then, keep reading and keep learning!


Bình luận