Query Optimization in SQL - https://www.thetechplatform.com/post/query-optimization-in-sql
Fixing bad queries and resolving performance problems can involve hours (or days) of research and testing. Sometimes we can quickly cut that time by identifying common design patterns that are indicative of poorly performing TSQL.
Developing pattern recognition for these easy-to-spot eyesores can allow us to immediately focus on what is most likely to the problem. Whereas performance tuning can often be composed of hours of collecting extended events, traces, execution plans, and statistics, being able to identify potential pitfalls quickly can short-circuit all of that work.
While we should perform our due diligence and prove that any changes we make are optimal, knowing where to start can be a huge time saver!
Tips and tricks
OR in the Join Predicate/WHERE Clause Across Multiple Columns
SQL Server can efficiently filter a data set using indexes via the WHERE clause or any combination of filters that are separated by an AND operator. By being exclusive, these operations take data and slice it into progressively smaller pieces, until only our result set remains.
OR is a different story. Because it is inclusive, SQL Server cannot process it in a single operation. Instead, each component of the OR must be evaluated independently. When this expensive operation is completed, the results can then be concatenated and returned normally.
The scenario in which OR performs worst is when multiple columns or tables are involved. We not only need to evaluate each component of the OR clause, but need to follow that path through the other filters and tables within the query. Even if only a few tables or columns are involved, the performance can become mind-bogglingly bad.
Here is a very simple example of how an OR can cause performance to become far worse than you’d ever imagine it could be:
SELECT DISTINCT
 PRODUCT.ProductID,
 PRODUCT.Name
FROM Production.Product PRODUCT
INNER JOIN Sales.SalesOrderDetail DETAIL
ON PRODUCT.ProductID = DETAIL.ProductID
OR PRODUCT.rowguid = DETAIL.rowguid;
The query is simple enough: 2 tables and a join that checks both ProductID and rowguid. Even if none of these columns were indexed, our expectation would be a table scan on Product and a table scan on SalesOrderDetail. Expensive, but at least something we can comprehend. Here is the resulting performance of this query:
We did scan both tables, but processing the OR took an absurd amount of computing power. 1.2 million reads were made in this effort! Considering that Product contains only 504 rows and SalesOrderDetail contains 121317 rows, we read far more data than the full contents of each of these tables. In addition, the query took about 2 seconds to execute on a relatively speedy SSD-powered desktop.
The take-away from this scary demo is that SQL Server cannot easily process an OR condition across multiple columns. The best way to deal with an OR is to eliminate it (if possible) or break it into smaller queries. Breaking a short and simple query into a longer, more drawn-out query may not seem elegant, but when dealing with OR problems, it is often the best choice:
SELECT
 PRODUCT.ProductID,
 PRODUCT.Name
FROM Production.Product PRODUCT
INNER JOIN Sales.SalesOrderDetail DETAIL
ON PRODUCT.ProductID = DETAIL.ProductID
UNION
SELECT
 PRODUCT.ProductID,
 PRODUCT.Name
FROM Production.Product PRODUCT
INNER JOIN Sales.SalesOrderDetail DETAIL
ON PRODUCT.rowguid = DETAIL.rowguid
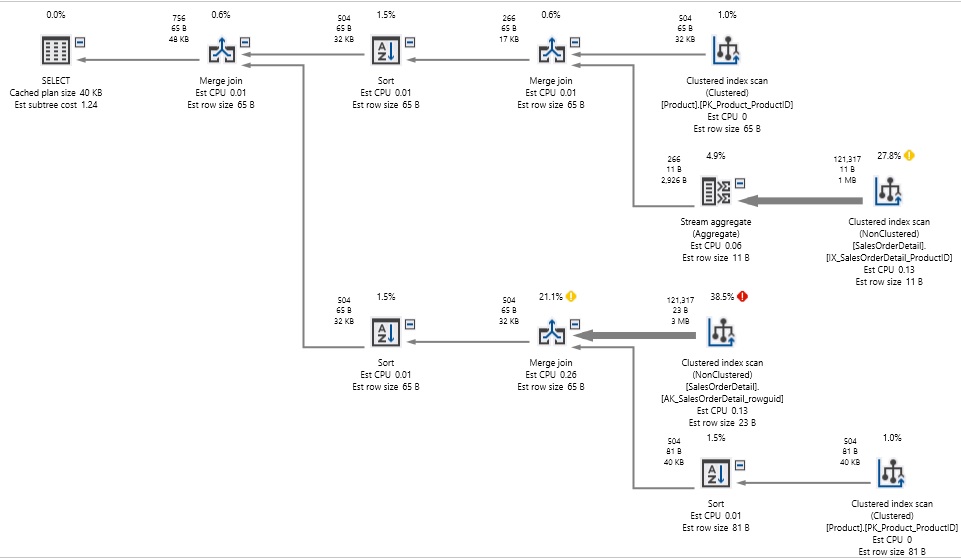
In this rewrite, we took each component of the OR and turned it into its own SELECT statement. UNION concatenates the result set and removes duplicates. Here is the resulting performance:
The execution plan got significantly more complex, as we are querying each table twice now, instead of once, but we no longer needed to play pin-the-tail-on-the-donkey with the result sets as we did before. The reads have been cut down from 1.2 million to 750, and the query executed in well under a second, rather than in 2 seconds.
Note that there are still a boatload of index scans in the execution plan, but despite the need to scan tables four times to satisfy our query, performance is much better than before.
Use caution when writing queries with an OR clause. Test and verify that performance is adequate and that you are not accidentally introducing a performance bomb similar to what we observed above. If you are reviewing a poorly performing application and run across an OR across different columns or tables, then focus on that as a possible cause. This is an easy to identify query pattern that will often lead to poor performance.
Wildcard String Searches
String searching efficiently can be challenging, and there are far more ways to grind through strings inefficiently than efficiently. For frequently searched string columns, we need to ensure that:
Indexes are present on searched columns.
Those indexes can be used.
If not, can we use full-text indexes?
If not, can we use hashes, n-grams, or some other solution?
Without use of additional features or design considerations, SQL Server is not good at fuzzy string searching. That is, if I want to detect the presence of a string in any position within a column, getting that data will be inefficient:
SELECT
 Person.BusinessEntityID,
 Person.FirstName,
 Person.LastName,
 Person.MiddleName
FROM Person.Person
WHERE Person.LastName LIKE '%For%';
In this string search, we are checking LastName for any occurrence of “For” in any position within the string. When a “%” is placed at the beginning of a string, we are making use of any ascending index impossible. Similarly, when a “%” is at the end of a string, using a descending index is also impossible. The above query will result in the following performance:
As expected, the query results in a scan on Person.Person. The only way to know if a substring exists within a text column is to churn through every character in every row, searching for occurrences of that string. On a small table, this may be acceptable, but against any large data set, this will be slow and painful to wait for.
There are a variety of ways to attack this situation, including:
Re-evaluate the application. Do we really need to do a wildcard search in this manner? Do users really want to search all parts of this column for a given string? If not, get rid of this capability and the problem vanishes!
Can we apply any other filters to the query to reduce the data size prior to crunching the string comparison? If we can filter by date, time, status, or some other commonly used type of criteria, we can perhaps reduce the data we need to scan down to a small enough amount so that our query perform acceptably.
Can we do a leading string search, instead of a wildcard search? Can “%For%” be changed to “For%”?
Is full-text indexing an available option? Can we implement and use it?
Can we implement a query hash or n-gram solution?
The first 3 options above are as much design/architecture considerations as they are optimization solutions. They ask: What else can we assume, change, or understand about this query to tweak it to perform well? These all require some level of application knowledge or the ability to change the data returned by a query. These may not be options available to us, but it is important to get all parties involved on the same page with regard to string searching. If a table has a billion rows and users want to frequently search an NVARCHAR(MAX) column for occurrences of strings in any position, then a serious discussion needs to occur as to why anyone would want to do this, and what alternatives are available. If that functionality is truly important, then the business will need to commit additional resources to support expensive string searching, or accept a whole lot of latency and resource consumption in the process.
Full-Text Indexing is a feature in SQL Server that can generate indexes that allow for flexible string searching on text columns. This includes wildcard searches, but also linguistic searching that uses the rules of a given language to make smart decisions about whether a word or phrase are similar enough to a column’s contents to be considered a match. While flexible, Full-Text is an additional feature that needs to be installed, configured, and maintained. For some applications that are very string-centric, it can be the perfect solution! A link has been provided at the end of this article with more details on this feature, what it can do, and how to install and configure it.
One final option available to us can be a great solution for shorter string columns. N-Grams are string segments that can be stored separately from the data we are searching and can provide the ability to search for substrings without the need to scan a large table. Before discussing this topic, it is important to fully understand the search rules that are used by an application. For example:
Are there a minimum or maximum number of characters allowed in a search?
Are empty searches (a table scan) allowed?
Are multiple words/phrases allowed?
Do we need to store substrings at the start of a string? These can be collected with an index seek if needed.
Once these considerations are assessed, we can take a string column and break it into string segments. For example, consider a search system where there is a minimum search length of 3 characters, and the stored word “Dinosaur”. Here are the substrings of Dinosaur that are 3 characters in length or longer (ignoring the start of the string, which can be gathered separately & quickly with an index seek against this column):
ino, inos, inosa, inosau, inosaur, nos, nosa, nosau, nosaur, osa, osau, osaur, sau, saur, aur.
If we were to create a separate table that stored each of these substrings (also known as n-grams), we can link those n-grams to the row in our big table that has the word dinosaur. Instead of scanning a big table for results, we can instead do an equality search against the n-gram table. For example, if I did a wildcard search for “dino”, my search can be redirected to a search that would look like this:
SELECT
 n_gram_table.my_big_table_id_column
FROM dbo.n_gram_table
WHERE n_gram_table.n_gram_data = 'Dino';
Assuming n_gram_data is indexed, then we will quickly return all IDs for our large table that have the word Dino anywhere in it. The n-gram table only requires 2 columns, and we can bound the size of the n-gram string using our application rules defined above. Even if this table gets large, it would likely still provide very fast search capabilities.
The cost of this approach is maintenance. We need to update the n-gram table every time a row is inserted, deleted, or the string data in it is updated. Also, the number of n-grams per row will increase rapidly as the size of the column increases. As a result, this is an excellent approach for shorter strings, such as names, zip codes, or phone numbers. It is a very expensive solution for longer strings, such as email text, descriptions, and other free-form or MAX length columns.
To quickly recap: Wildcard string searching is inherently expensive. Our best weapons against it are based on design and architecture rules that allow us to either eliminate the leading “%”, or limit how we search in ways that allow for other filters or solutions to be implemented. A link has been provided at the end of this article with more information on, and some demos of generating and using n-gram data. While a more involved implementation, it is another weapon in our arsenal when other options have failed us.
Large Write Operations
After a discussion of why iteration can cause poor performance, we are now going to explore a scenario in which iteration IMPROVES performance. A component of optimization not yet discussed here is contention. When we perform any operation against data, locks are taken against some amount of data to ensure that the results are consistent and do not interfere with other queries that are being executed against the same data by others besides us.
Locking and blocking are good things in that they safeguard data from corruption and protect us from bad result sets. When contention continues for a long time, though, important queries may be forced to wait, resulting in unhappy users and the resulting latency complaints.
Large write operations are the poster-child for contention as they will often lock an entire table during the time it takes to update the data, check constraints, update indexes, and process triggers (if any exist). How large is large? There is no strict rule here. On a table with no triggers or foreign keys, large could be 50,000, 100,000, or 1,000,000 rows. On a table with many constraints and triggers, large might be 2,000. The only way to confirm that this is a problem is to test it, observe it, and respond accordingly.
In addition to contention, large write operations will generate lots of log file growth. Whenever writing unusually big volumes of data, keep an eye on the transaction log and verify that you do not risk filling it up, or worse, filling up its physical storage location.
Note that many large write operations will result from our own work: Software releases, data warehouse load processes, ETL processes, and other similar operations may need to write a very large amount of data, even if it is done infrequently. It is up to us to identify the level of contention allowed in our tables prior to running these processes. If we are loading a large table during a maintenance window when no one else is using it, then we are free to deploy using whatever strategy we wish. If we are instead writing large amounts of data to a busy production site, then reducing the rows modified per operation would be a good safeguard against contention.
Common operations that can result in large writes are:
Adding a new column to a table and backfilling it across the entire table.
Updating a column across an entire table.
Changing the data type of a column. See link at the end of the article for more info on this.
Importing a large volume of new data.
Archiving or deleting a large volume of old data.
This may not often be a performance concern, but understanding the effects of very large write operations can avoid important maintenance events or releases from going off-the-rails unexpectedly.
Missing Indexes
SQL Server, via the Management Studio GUI, execution plan XML, or missing index DMVs, will let us know when there are missing indexes that could potentially help a query perform better:
This warning is useful in that it lets us know that there is a potentially easy fix to improve query performance. It is also misleading in that an additional index may not be the best way to resolve a latency issue. The green text provides us with all of the details of a new index, but we need to do a bit of work before considering taking SQL Server’s advice:
Are there any existing indexes that are similar to this one that could be modified to cover this use case?
Do we need all of the include columns? Would an index on only the sorting columns be good enough?
How high is the impact of the index? Will it improve a query by 98%, or only 5%.
Does this index already exist, but for some reason the query optimizer is not choosing it?
Often, the suggested indexes are excessive. For example, here is the index creation statement for the partial plan shown above:
CREATE NONCLUSTERED INDEX <Name of Missing Index, sysname,>
ON Sales.SalesOrderHeader (Status,SalesPersonID)
INCLUDE (SalesOrderID,SubTotal)
In this case, there is already an index on SalesPersonID. Status happens to be a column in which the table mostly contains one value, which means that as a sorting column it would not provide very much value. The impact of 19% isn’t terribly impressive. We would ultimately be left to ask whether the query is important enough to warrant this improvement. If it is executed a million times a day, then perhaps all of this work for a 20% improvement is worth it.
Consider another alternative index recommendation:
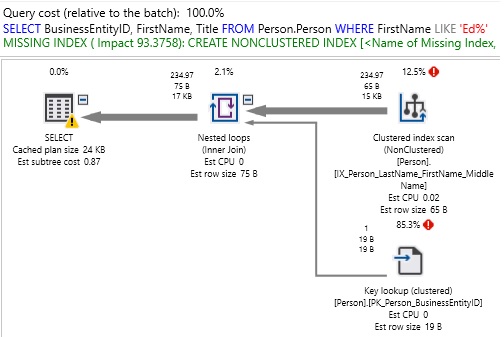
Here, the missing index suggested is:
CREATE NONCLUSTERED INDEX [<Name of Missing Index, sysname,>]
ON [Person].[Person] ([FirstName])
INCLUDE ([BusinessEntityID],[Title])
This time, the suggested index would provide a 93% improvement and handle an unindexed column (FirstName). If this is at all a frequently run query, then adding this index would likely be a smart move. Do we add BusinessEntityID and Title as INCLUDE columns? This is far more of a subjective question and we need to decide if the query is important enough to want to ensure there is never a key lookup to pull those additional columns back from the clustered index. This question is an echo of, “How do we know when a query’s performance is optimal?”. If the non-covering index is good enough, then stopping there would be the correct decision as it would save the computing resources required to store the extra columns. If performance is still not good enough, then adding the INCLUDE columns would be the logical next step.
As long as we remember that indexes require maintenance and slow down write operations, we can approach indexing from a pragmatic perspective and ensure that we do not make any of these mistakes:
Over-Indexing a Table
When a table has too many indexes, write operations become slower as every UPDATE, DELETE, and INSERT that touches an indexed column must update the indexes on it. In addition, those indexes take up space on storage as well as in database backups. “Too Many” is vague, but emphasizes that ultimately application performance is the key to determining whether things are optimal or not.
Under-Indexing a Table
An under-indexed table does not serve read queries effectively. Ideally, the most common queries executed against a table should benefit from indexes. Less frequent queries are evaluated on a case-by-case need and indexed when beneficial. When troubleshooting a performance problem against tables that have few or no non-clustered indexes, then the issue is likely an under-indexing one. In these cases, feel empowered to add indexes to improve performance as needed!
No Clustered Index/Primary Key
All tables should have a clustered index and a primary key. Clustered indexes will almost always perform better than heaps and will provide the necessary infrastructure to add non-clustered indexes efficiently when needed. A primary key provides valuable information to the query optimizer that helps it make smart decisions when creating execution plans. If you run into a table with no clustered index or no primary key, consider these top priorities to research and resolve before continuing with further research.
See the link at the end of this article for details on capturing, trending, and reporting on missing index data using SQL Server’s built-in dynamic management views. This allows you to learn about missing index suggestions when you may not be staring at your computer. It also allows you to see when multiple suggestions are made on a single query. The GUI will only display the top suggestion, but the raw XML for the execution plan will include as many as are suggested.
High Table Count
The query optimizer in SQL Server faces the same challenge as any relational query optimizer: It needs to find a good execution plan in the face of many options in a very short span of time. It is essentially playing a game of chess and evaluating move after move. With each evaluation, it either throws away a chunk of plans similar to the suboptimal plan, or setting one aside as a candidate plan. More tables in a query would equate to a larger chess board. With significantly more options available, SQL Server has more work to do, but cannot take much longer to determine the plan to use.
Each table added to a query increases its complexity by a factorial amount. While the optimizer will generally make good decisions, even in the face of many tables, we increase the risk of inefficient plans with each table added to a query. This is not to say that queries with many tables are bad, but that we need to use caution when increasing the size of a query. For each set of tables, it needs to determine join order, join type, and how/when to apply filters and aggregation.
Based on how tables are joined, a query will fall into one of two basic forms:
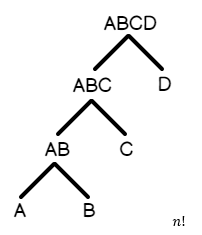
Left-Deep Tree: A join B, B join C, C join D, D join E, etc…This is a query in which most tables are sequentially joined one after another.
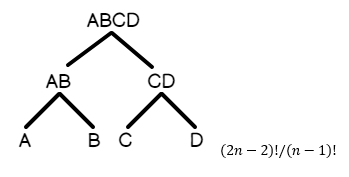
Bushy Tree: A join B, A join C, B join D, C join E, etc…This is a query in which tables branch out into multiple logical units within each branch of the tree.
Here is a graphical representation of a bushy tree, in which the joins branch upwards into the result set:
Similarly, here is a representation of what a left-deep tree would look like.
Since the left-deep tree is more naturally ordered based on how the tables are joined, the number of candidate execution plans for the query are less than for a bushy tree. Included above is the math behind the combinatorics: that is, how many plans will be generated on average for a given query type.
To emphasize the enormity of the math behind table counts, consider a query that accesses 12 tables:
SELECT TOP 25
 Product.ProductID,
 Product.Name AS ProductName,
 Product.ProductNumber,
 CostMeasure.UnitMeasureCode,
 CostMeasure.Name AS CostMeasureName,
 ProductVendor.AverageLeadTime,
 ProductVendor.StandardPrice,
 ProductReview.ReviewerName,
 ProductReview.Rating,
 ProductCategory.Name AS CategoryName,
 ProductSubCategory.Name AS SubCategoryName
FROM Production.Product
INNER JOIN Production.ProductSubCategory
ON ProductSubCategory.ProductSubcategoryID = Product.ProductSubcategoryID
INNER JOIN Production.ProductCategory
ON ProductCategory.ProductCategoryID = ProductSubCategory.ProductCategoryID
INNER JOIN Production.UnitMeasure SizeUnitMeasureCode
ON Product.SizeUnitMeasureCode = SizeUnitMeasureCode.UnitMeasureCode
INNER JOIN Production.UnitMeasure WeightUnitMeasureCode
ON Product.WeightUnitMeasureCode = WeightUnitMeasureCode.UnitMeasureCode
INNER JOIN Production.ProductModel
ON ProductModel.ProductModelID = Product.ProductModelID
LEFT JOIN Production.ProductModelIllustration
ON ProductModel.ProductModelID = ProductModelIllustration.ProductModelID
LEFT JOIN Production.ProductModelProductDescriptionCulture
ON ProductModelProductDescriptionCulture.ProductModelID = ProductModel.ProductModelID
LEFT JOIN Production.ProductDescription
ON ProductDescription.ProductDescriptionID = ProductModelProductDescriptionCulture.ProductDescriptionID
LEFT JOIN Production.ProductReview
ON ProductReview.ProductID = Product.ProductID
LEFT JOIN Purchasing.ProductVendor
ON ProductVendor.ProductID = Product.ProductID
LEFT JOIN Production.UnitMeasure CostMeasure
ON ProductVendor.UnitMeasureCode = CostMeasure.UnitMeasureCode
ORDER BY Product.ProductID DESC;
With 12 tables in a relatively busy-style query, the math would work out to:
(2n-2)! / (n-1)! = (2*12-1)! / (12-1)! = 28,158,588,057,600 possible execution plans.
If the query had happened to be more linear in nature, then we would have:
n! = 12! = 479,001,600 possible execution plans.
This is only for 12 tables! Imagine a query on 20, 30, or 50 tables! The optimizer can often slice those numbers down very quickly by eliminating entire swaths of sub-optimal options, but the odds of it being able to do so and generate a good plan decrease as table count increases.
What are some useful ways to optimize a query that is suffering due to too many tables?
Move metadata or lookup tables into a separate query that places this data into a temporary table.
Joins that are used to return a single constant can be moved to a parameter or variable.
Break a large query into smaller queries whose data sets can later be joined together when ready.
For very heavily used queries, consider an indexed view to streamline constant access to important data.
Remove unneeded tables, subqueries, and joins.
Breaking up a large query into smaller queries requires that there will be no data change in between those queries that would somehow invalidate the result set. If a query needs to be an atomic set, then you may need to use a mix of isolation levels, transactions, and locking to ensure data integrity.
More often than not when we are joining a large number of tables together, we can break the query up into smaller logical units that can be executed separately. For the example query earlier on 12 tables, we could very easily remove a few unused tables and split out the data retrieval into two separate queries:
SELECT TOP 25
 Product.ProductID,
 Product.Name AS ProductName,
 Product.ProductNumber,
 ProductCategory.Name AS ProductCategory,
 ProductSubCategory.Name AS ProductSubCategory,
 Product.ProductModelID
INTO #Product
FROM Production.Product
INNER JOIN Production.ProductSubCategory
ON ProductSubCategory.ProductSubcategoryID = Product.ProductSubcategoryID
INNER JOIN Production.ProductCategory
ON ProductCategory.ProductCategoryID = ProductSubCategory.ProductCategoryID
ORDER BY Product.ModifiedDate DESC;

SELECT
 Product.ProductID,
 Product.ProductName,
 Product.ProductNumber,
 CostMeasure.UnitMeasureCode,
 CostMeasure.Name AS CostMeasureName,
 ProductVendor.AverageLeadTime,
 ProductVendor.StandardPrice,
 ProductReview.ReviewerName,
 ProductReview.Rating,
 Product.ProductCategory,
 Product.ProductSubCategory
FROM #Product Product
INNER JOIN Production.ProductModel
ON ProductModel.ProductModelID = Product.ProductModelID
LEFT JOIN Production.ProductReview
ON ProductReview.ProductID = Product.ProductID
LEFT JOIN Purchasing.ProductVendor
ON ProductVendor.ProductID = Product.ProductID
LEFT JOIN Production.UnitMeasure CostMeasure
ON ProductVendor.UnitMeasureCode = CostMeasure.UnitMeasureCode;

DROP TABLE #Product;
This is only one of many possible solutions, but is a way to reduce a larger, more complex query into two simpler ones. As a bonus, we can review the tables involved and remove any unneeded tables, columns, variables, or anything else that may not be needed to return the data we are looking for.
Table count is a hefty contributor towards poor execution plans as it forces the query optimizer to sift through a larger result set and discard more potentially valid results in the search for a great plan in well under a second. If you are evaluating a poorly performing query that has a very large table count, try splitting it into smaller queries. This tactic may not always provide a significant improvement, but is often effective when other avenues have been explored and there are many tables that are being heavily read together in a single query.
Query Hints
A query hint is an explicit direction by us to the query optimizer. We are bypassing some of the rules used by the optimizer to force it to behave in ways that it normally wouldn’t. In this regard, it’s more of a directive than a hint.
Query hints are often used when we have a performance problem and adding a hint quickly and magically fixes it. There are quite a few hints available in SQL Server that affect isolation levels, join types, table locking, and more. While hints can have legitimate uses, they present a danger to performance for many reasons:
Future changes to the data or schema may result in a hint no longer being applicable and becoming a hindrance until removed.
Hints can obscure larger problems, such as missing indexes, excessively large data requests, or broken business logic. Solving the root of a problem is preferable than solving a symptom.
Hints can result in unexpected behavior, such as bad data from dirty reads via the use of NOLOCK.
Applying a hint to address an edge case may cause performance degradation for all other scenarios.
The general rule of thumb is to apply query hints as infrequently as possible, only after sufficient research has been conducted, and only when we are certain there will be no ill effects of the change. They should be used as a scalpel when all other options fail. A few notes on commonly used hints:
NOLOCK: In the event that data is locked, this tells SQL Server to read data from the last known value available, also known as a dirty read. Since it is possible to use some old values and some new values, data sets can contain inconsistencies. Do not use this in any place in which data quality is important.
RECOMPILE: Adding this to the end of a query will result in a new execution plan being generated each time this query executed. This should not be used on a query that is executed often, as the cost to optimize a query is not trivial. For infrequent reports or processes, though, this can be an effective way to avoid undesired plan reuse. This is often used as a bandage when statistics are out of date or parameter sniffing is occurring.
MERGE/HASH/LOOP: This tells the query optimizer to use a specific type of join as part of a join operation. This is super-risky as the optimal join will change as data, schema, and parameters evolve over time. While this may fix a problem right now, it will introduce an element of technical debt that will remain for as long as the hint does.
OPTIMIZE FOR: Can specify a parameter value to optimize the query for. This is often used when we want performance to be controlled for a very common use case so that outliers do not pollute the plan cache. Similar to join hints, this is fragile and when business logic changes, this hint usage may become obsolete.
Consider our name search query from earlier:
SELECT
 e.BusinessEntityID,
 p.Title,
 p.FirstName,
 p.LastName
FROM HumanResources.Employee e
INNER JOIN Person.Person p
ON p.BusinessEntityID = e.BusinessEntityID
WHERE FirstName LIKE 'E%'
We can force a MERGE JOIN in the join predicate:
SELECT
 e.BusinessEntityID,
 p.Title,
 p.FirstName,
 p.LastName
FROM HumanResources.Employee e
INNER MERGE JOIN Person.Person p
ON p.BusinessEntityID = e.BusinessEntityID
WHERE FirstName LIKE 'E%'
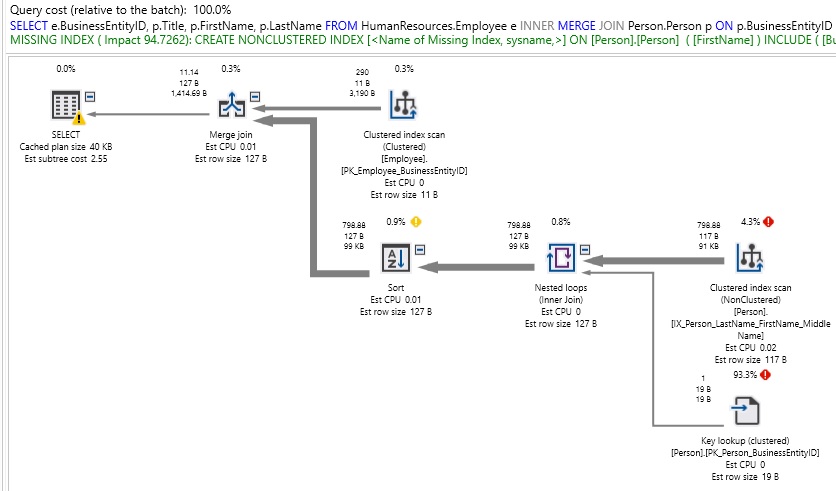
When we do so, we might observe better performance under certain circumstances, but may also observe very poor performance in others:
For a relatively simple query, this is quite ugly! Also note than our join type has limited index usage, and as a result we are getting an index recommendation where we likely shouldn’t need/want one. In fact, forcing a MERGE JOIN added additional operators to our execution plan in order to appropriately sort outputs for use in resolving our result set. We can force a HASH JOIN similarly:
SELECT
 e.BusinessEntityID,
 p.Title,
 p.FirstName,
 p.LastName
FROM HumanResources.Employee e
INNER HASH JOIN Person.Person p
ON p.BusinessEntityID = e.BusinessEntityID
WHERE FirstName LIKE 'E%'
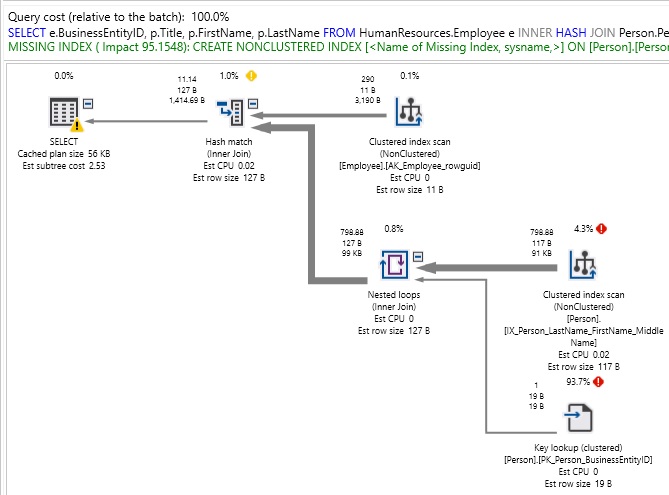
Again, the plan is not pretty! Note the warning in the output tab that informs us that the join order has been enforced by our join choice. This is important as it tells is that the join type we chose also limited the possible ways to order the tables during optimization. Essentially, we have removed many useful tools available to the query optimizer and forced it to work with far less than it needs to succeed.
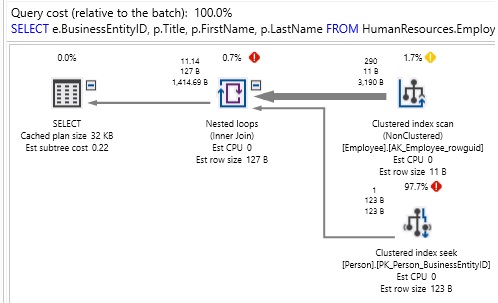
If we remove the hints, then the optimizer will choose a NESTED LOOP join and get the following performance:
Hints are often used as quick fixes to complex or messy problems. While there are legit reasons to use a hint, they are generally held onto as last resorts. Hints are additional query elements that require maintenance and review over time as application code, data, or schema change. If needed, be sure to thoroughly document their use! It is unlikely that a DBA or developer will know why you used a hint in 3 years unless you document its need very well.
Conclusion
In this article we discussed a variety of common query mistakes that can lead to poor performance. Since they are relatively easy to identify without extensive research, we can use this knowledge to improve our response time to latency or performance emergencies. This is only the tip of the iceberg, but provides a great starting point in finding the weak points in a script.
Whether by cleaning up joins and WHERE clauses or by breaking a large query into smaller chunks, focusing our evaluation, testing, and QA process will improve the quality of our results, in addition to allowing us to complete these projects faster.
Source: SQLShack










Comments